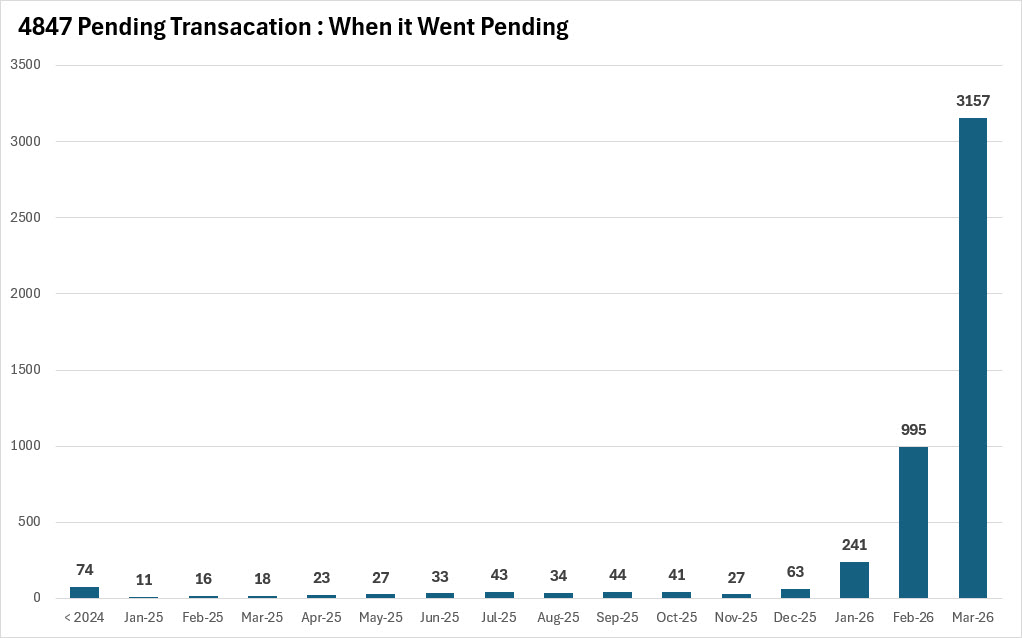
When Did These Pendings Actually Go Under Contract?
A question came up in today's session that is worth answering with the full data, because the answer is genuinely striking. Of the 4,847 total pending transactions currently active in the Austin market, 3,157 — roughly 65 percent — went pending in March 2026 alone. Another 995 went pending in February, meaning that nearly 85 percent of all current pending contracts were written in just the last two months. Everything before that is marginal by comparison: January contributed 241, December added 63, and every other month going back to early 2025 sits in a range of 11 to 74. The entire sub-2024 bucket — every contract older than 15 months — totals just 74 pending transactions.
What this data is really showing is recency. The pending inventory is not a backlog of slow-moving, stale contracts from a different market cycle. It is fresh demand, written by buyers who were active in Q1 of 2026. The February and March dominance also reflects something agents need to understand going into spring: the bulk of this pipeline was written when rates were either at or moving toward their recent low of 5.98 percent in late February, before the spike. Those buyers locked in early. The contracts that came together in March — the largest single-month block by a wide margin — were written through a period of rising rate pressure, which makes the volume even more meaningful. Buyers did not stop. They kept writing contracts even as borrowing costs moved against them.
For agents working with sellers, this data makes the comps conversation more precise. The buyers under contract right now are largely recent — they made decisions based on current market conditions, not 2024 pricing assumptions. For agents with buyers still on the sideline waiting for a more favorable environment, the chart is a useful counterargument: the people who went under contract in March 2026 did not wait for perfect conditions. They acted, and they are now 4,000-plus strong in the pending column.
The Month-to-Date Story Is Built on Positive Reversals
March's month-to-date data is showing inversion patterns that matter. Price increases are running at 930 — the highest figure since January 2025 — while price drops have fallen to 5,580, which is 346 fewer than the same period last year, the best comparison going all the way back to October 2024. Ninety-three percent of those price increases are coming from builders, which reflects where negotiating leverage has shifted in new construction. On the resale side, the story is price stability.
The average sold price is up $50,000 month over month — a figure that will settle closer to $35,000 as the month finalizes — and the median sold price is up $32,000 month over month, likely to land around $25,000–$28,000 by final count. The sold-to-list price ratio is at 97.36 percent, better than every month going back to May of last year. These are not heroic numbers. But they are all moving in the right direction, and they are doing so at the end of what was a difficult rate environment.
The Bond Market and Rate Outlook
Rates opened Monday down 10.5 basis points, crossing two repricing lines. The current rate is sitting at 6.625 percent, with a realistic path to 6.5 percent if the move holds through the day. For context, exactly one month ago rates were at 5.98 percent. The bond market then experienced one of the most significant yield rallies in the past decade — a move that has only occurred six times in the last 10 years, with three months worth of volatility compressed into a five-day window.
The economic calendar is heavy this week. JOLTS job openings drop Tuesday. The House Price Index — a lagging indicator averaging December, January, and February data — publishes Tuesday morning. Expect the headline to read "Austin down" on that report. That is accurate for that window. It is not accurate for what is happening right now, and agents need to be ready to explain the difference to clients who will see that headline. Friday brings non-farm payroll and the full employment picture. Given the rate volatility of the past five days, locking now at the current drop and using a lock-and-float strategy — where a lender reprices down if rates fall another 0.125 percent before closing — is the more defensible path than waiting for Friday. Lock-and-float means you capture today's improvement, but you are not permanently locked out of a further drop if the data cooperates.
Activity Index: More Zip Codes at 12-Month Highs Than Lows
Out of 75 zip codes tracked, 20 hit 12-month highs on the activity index this week. Only 2 hit 12-month lows — Lakeway (78738) and 78703. The activity index measures absorption: pending contracts divided by active plus pending. A high number means properties are moving fast relative to supply. A low number means the opposite.
The 78739 zip code is sitting at 51.67 percent — a multiple-offer market by any definition. At that level, an agent is not bluffing when they call a 5:00 p.m. final-and-best deadline. Buyers in that search need to be set up on an ASAP notification and ready to write above-list before they have even walked the property. On the other end of the spectrum, the 78734 zip code is low enough that buyers have time, negotiating room, and real leverage on concessions.
Months of inventory for the Austin metro overall is down 1.5 percent year over year. That same figure for Manor is up 67.9 percent. Hutto has gone from 1.23 months of inventory in March 2024 to 5.24 months — a 325.5 percent increase. The headline number is real. So is the zip-code number. For the 78705 West Campus submarket in the $350,000–$450,000 range, there are 126 months of inventory. Investors who bought there when rents were high are now exiting as rents have dropped 22.1 percent from peak, insurance and taxes have risen, and the cash flow math no longer works. That submarket is a seller's problem. The rest of the market is a different story entirely.
Market Flow Score Crosses the Recovery Threshold
The Market Flow Score is a normalized composite of all tracked data inputs — days on market, pending volume, new listings, month-over-month and year-over-year comparisons — scaled from 0 to 10. February's final score came in at 4.18, beating last February's 4.16. The rule is straightforward: you need four consecutive months of outperforming the same month from the prior year before the data confirms recovery — not trending toward it, confirmed. February 2026 was that fourth month. The bottom was not a dramatic announcement. It was a quiet crossing of a line in the data, and February is where it crossed.
Eight cities within the greater Austin area are now showing year-over-year price increases. Buda is up 29.2 percent year over year on the activity index and hit a 12-month high. Kyle and Bastrop are also at 12-month highs. Apartment vacancy peaked at 10 percent in June 2025 and has pulled back to 9.65 percent, with rent flat at $1,344 for two consecutive months — a pause in the decline that affects investor calculus and new construction economics going into the second half of 2026.